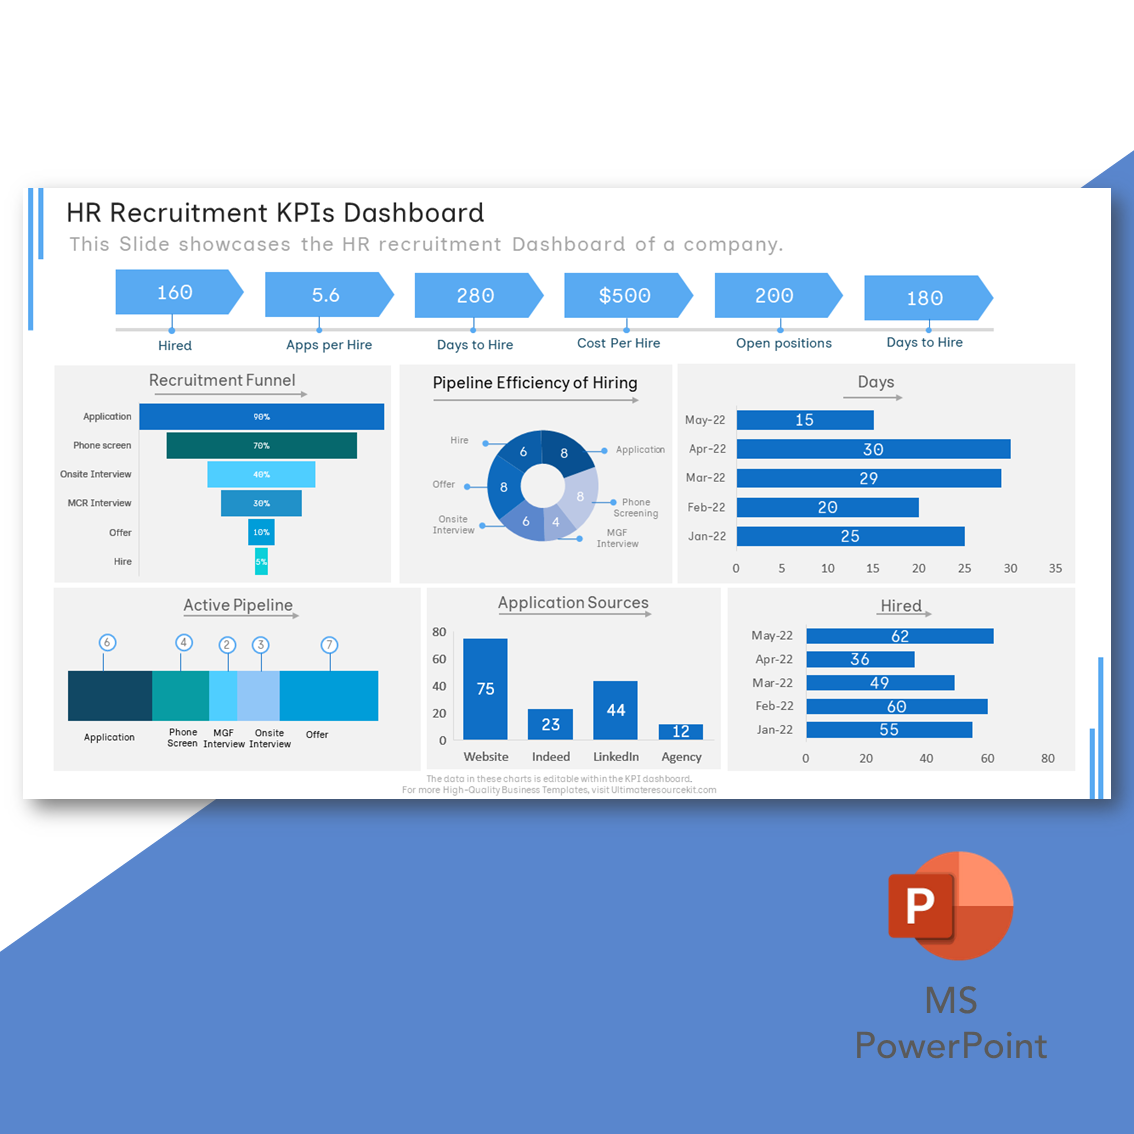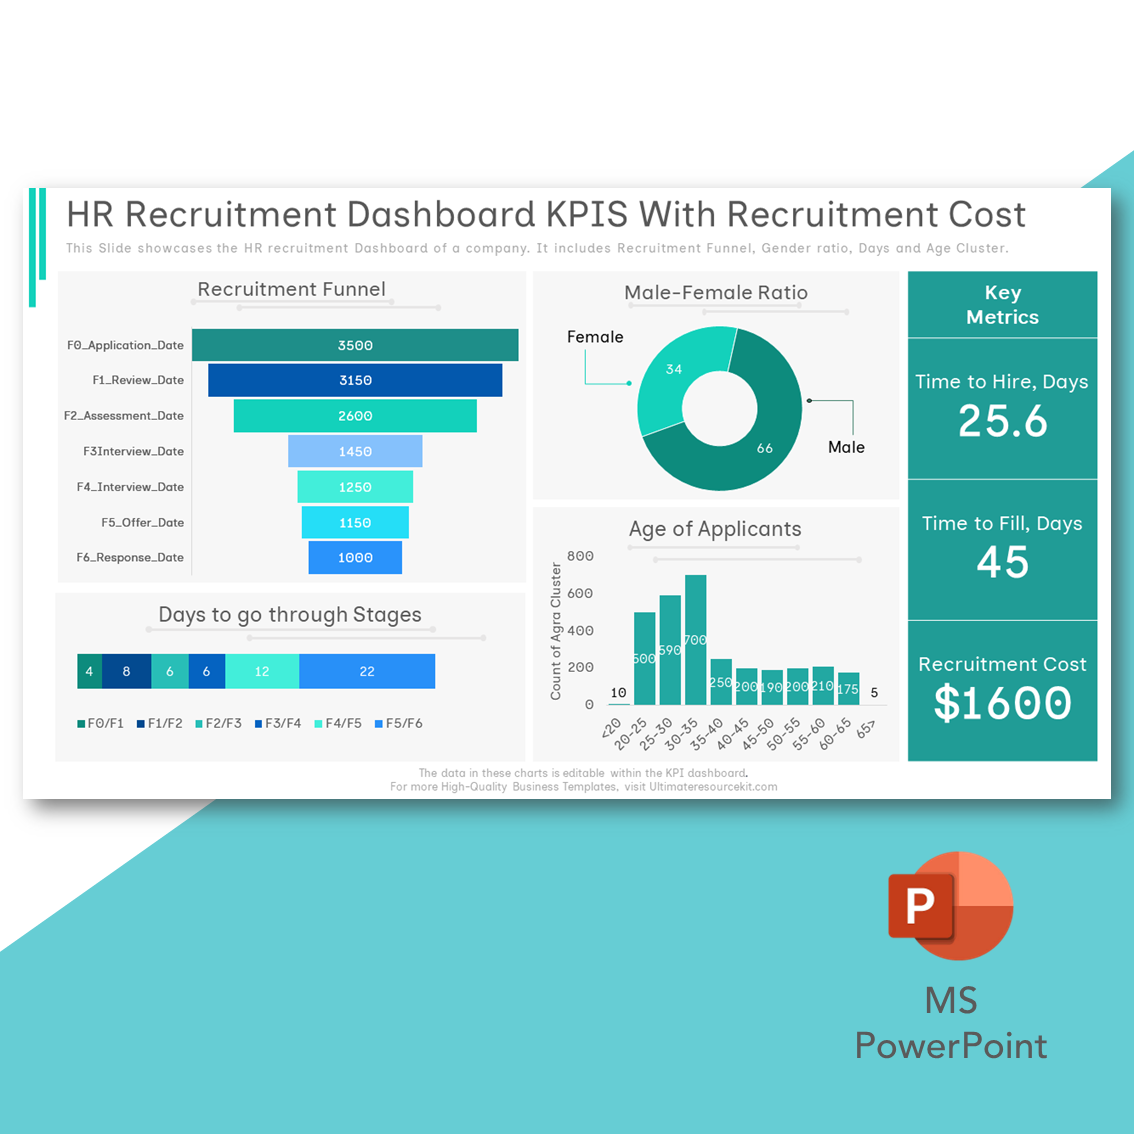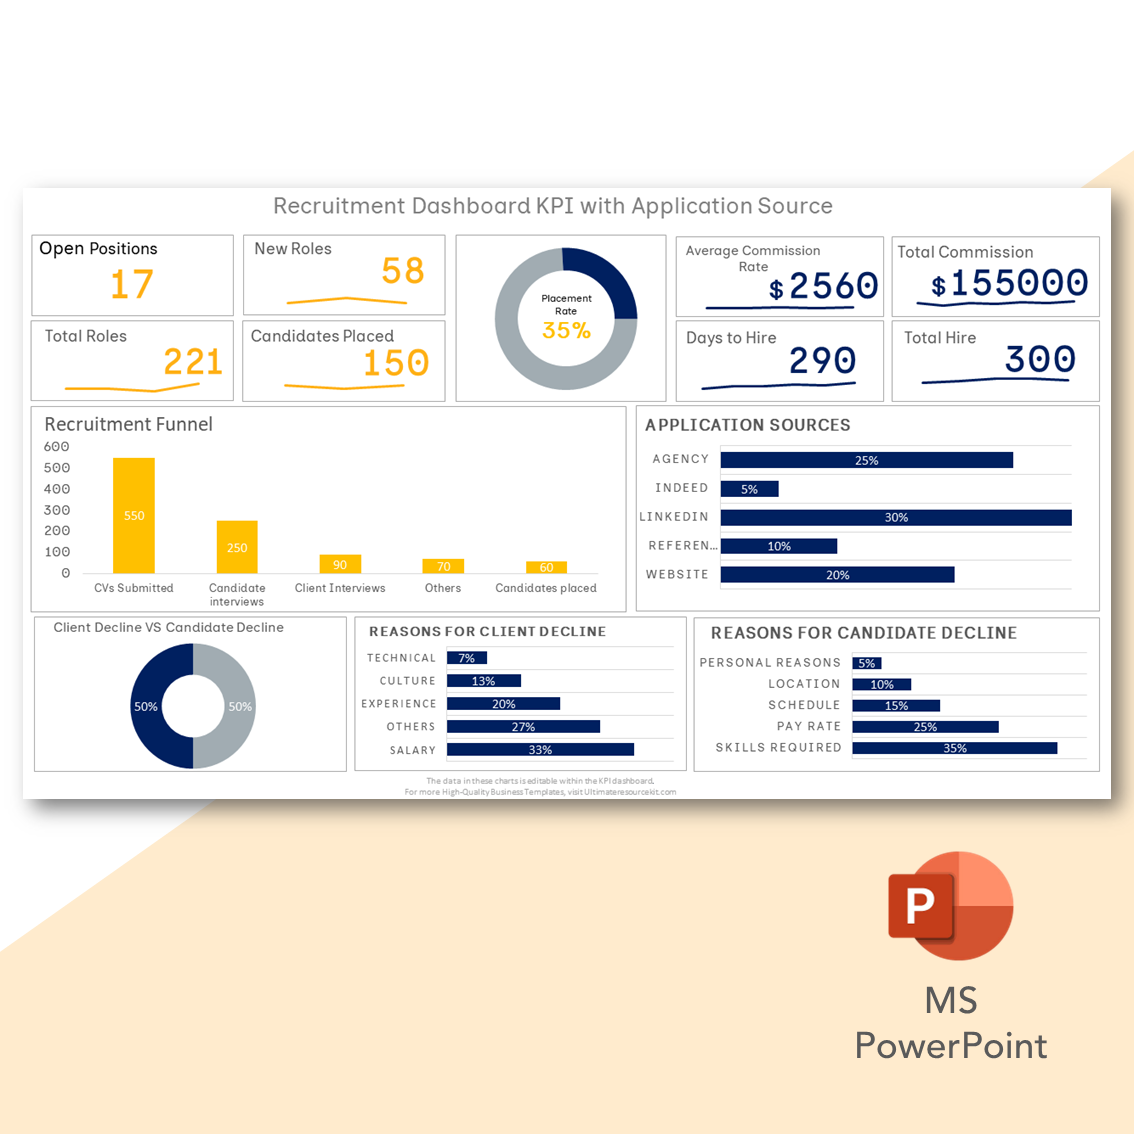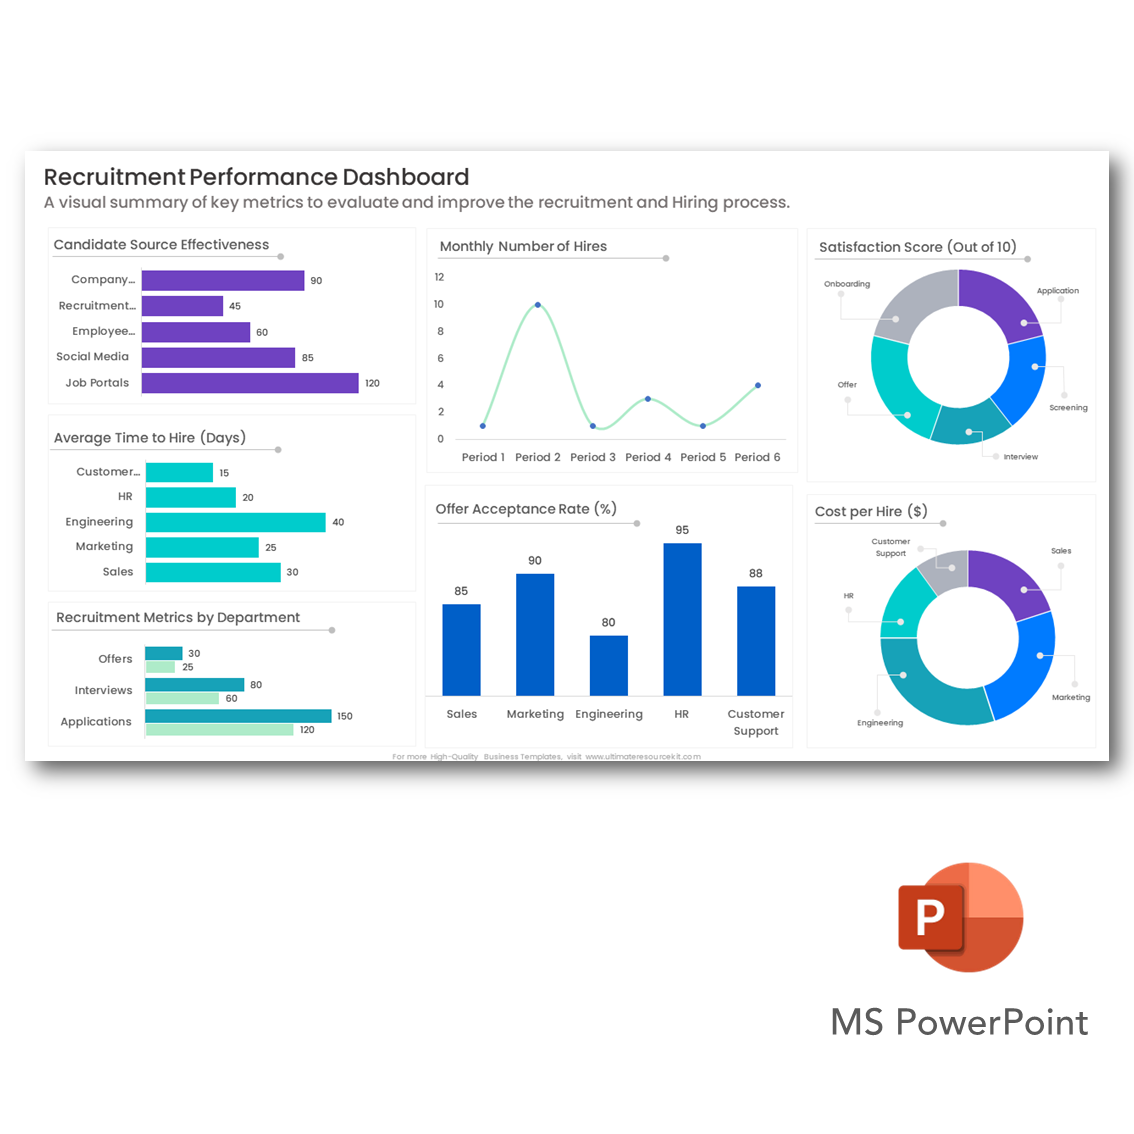
Recruitment Performance Metrics
This dashboard covers a wide range of key performance indicators (KPIs) that are essential for evaluating your recruitment efforts. While the numbers in the charts may change, the insights and benefits this dashboard offers remain constant. Let's explore what each section has to offer:
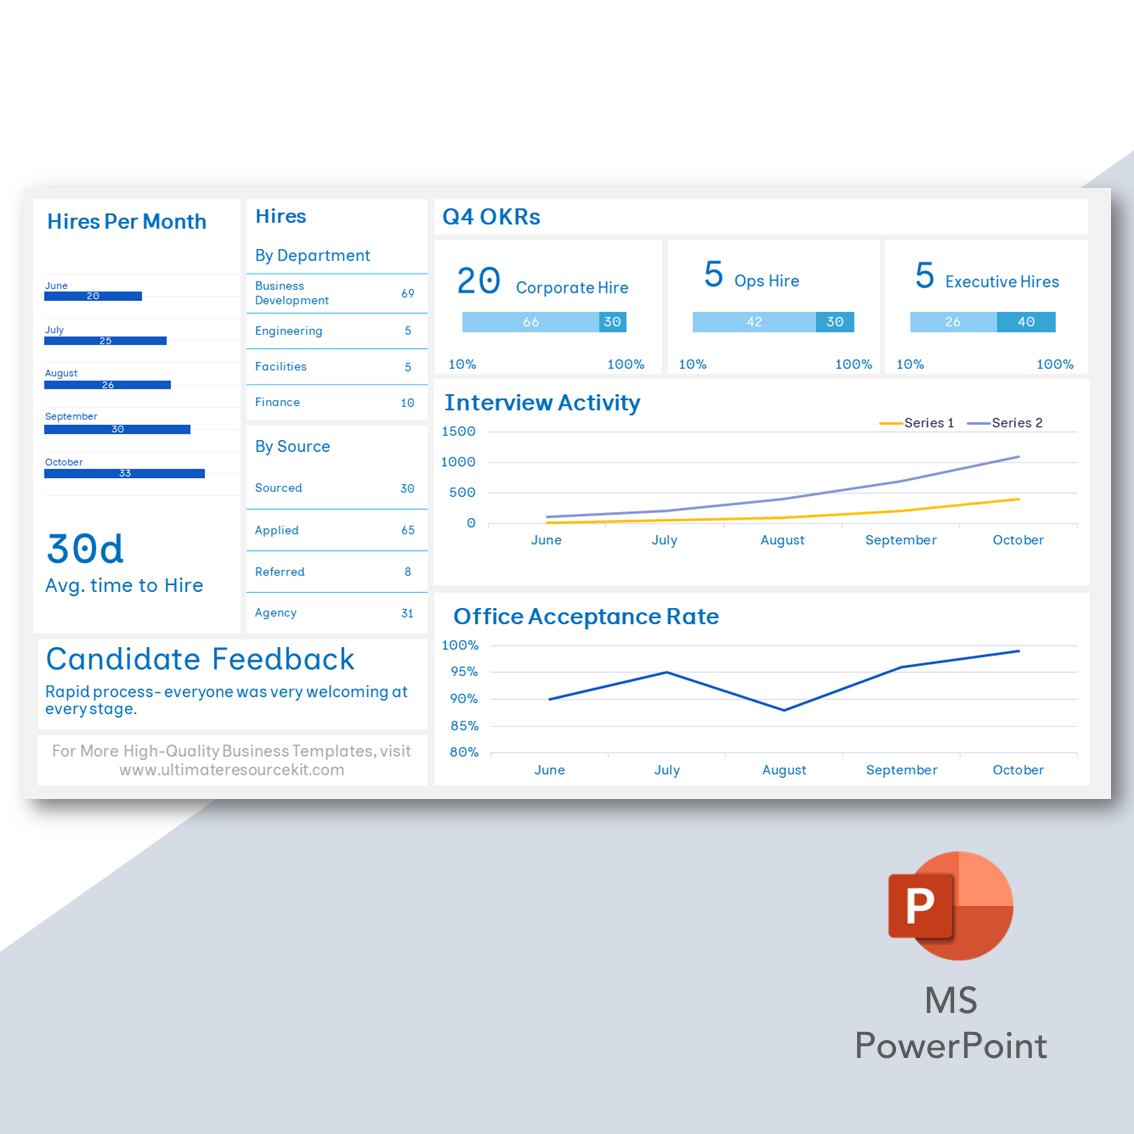
Interview Activity: This chart provides a visual representation of your interview activity over several months. It helps you track the percentage of candidates who progressed through different stages of the interview process, giving you insights into your team's efficiency and candidate engagement.
Office Acceptance Rate: Understanding how many candidates accept job offers is crucial. This chart shows your office acceptance rate over time, allowing you to identify trends and make improvements to increase your acceptance rate.
Hires Per Month: Monitoring the number of hires each month is essential for workforce planning. This chart helps you visualize your hiring trends, making it easier to spot seasonality or areas where you may need to ramp up your efforts.
Avg. Time to Hire: Time-to-hire is a critical metric for candidate experience and operational efficiency. This chart breaks down the average time it takes to hire candidates, helping you identify bottlenecks and streamline your recruitment process.
Candidate Feedback: Gathering feedback from candidates is invaluable. In this section, you can track candidate feedback to ensure a positive candidate experience. Rapid processes and welcoming interactions contribute to a positive candidate journey.
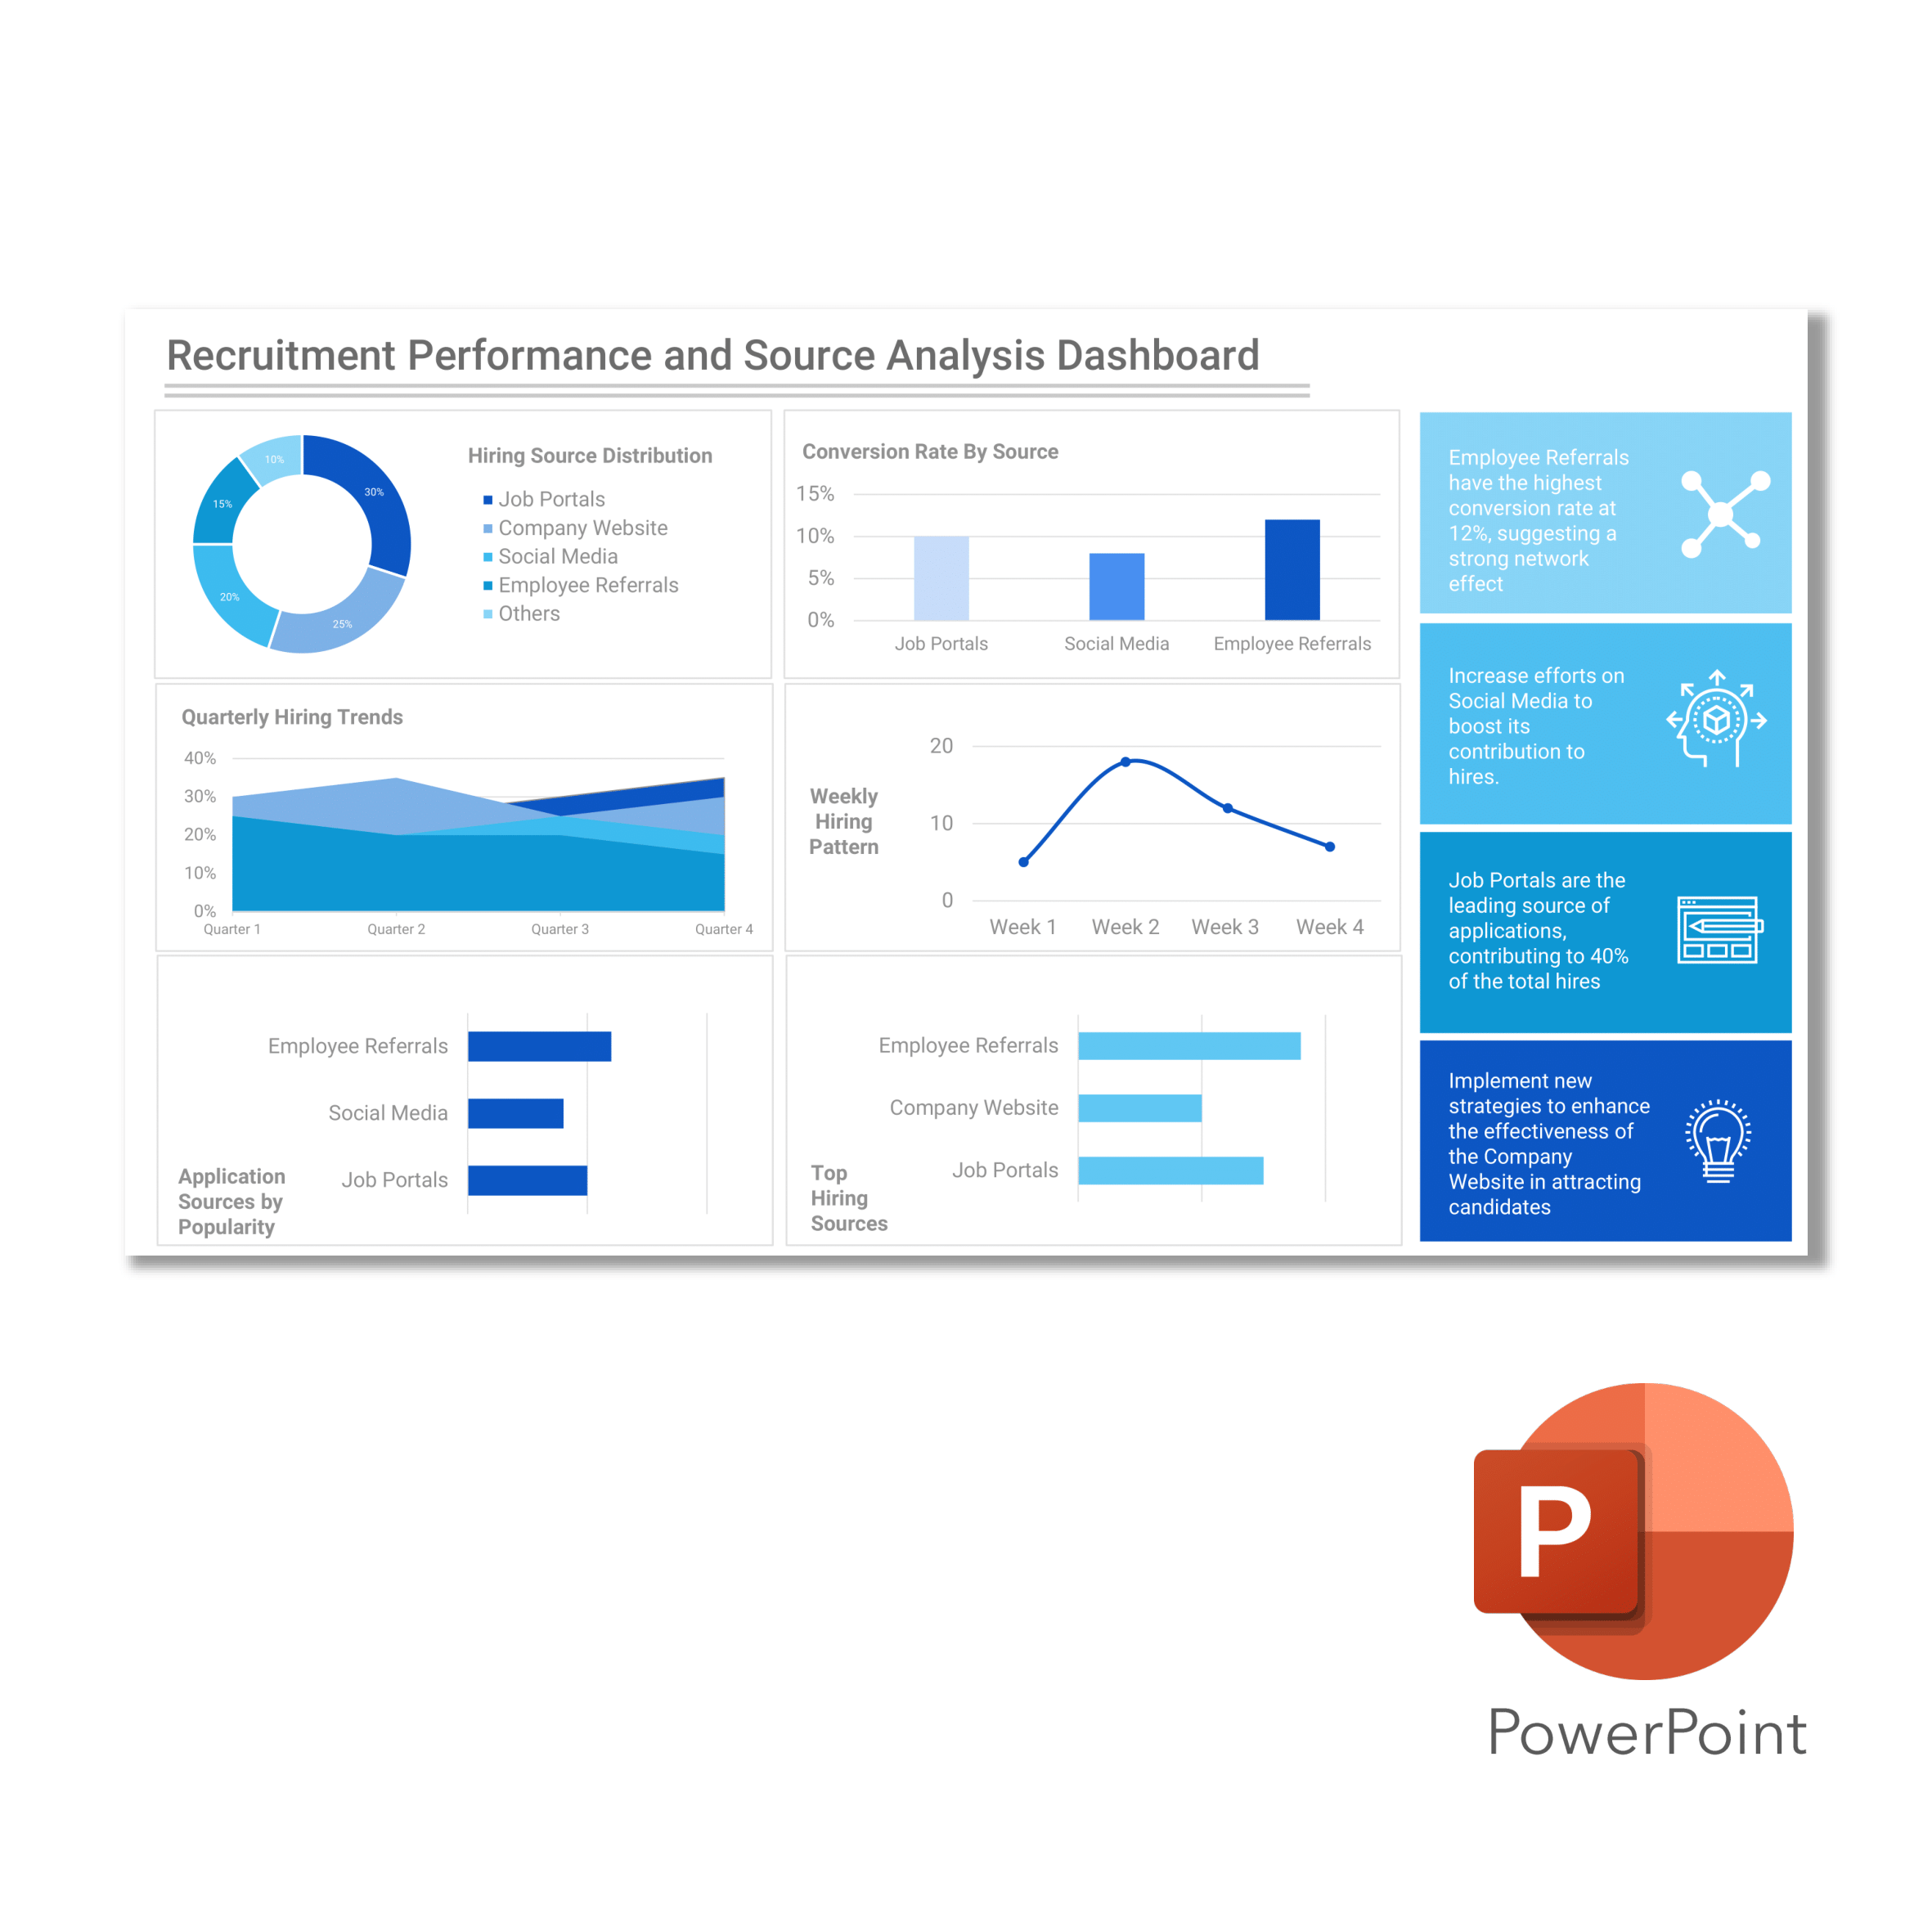
Hires by Department and Source: Understanding where your hires come from and which departments they join is crucial for resource allocation. This section breaks down your hires by department and source, helping you focus your efforts where they matter most.